Why?
I've been bringing up a gcc toolchain for ARM, specifically the STM32. So far the toolchain looks good. I'm able to build binaries with it and downloading and debuging via OpenOCD, a STLINK/V2 low cost debugger and gdb works as expected. Gdb as an interface is fine but I find it helps to take advantage of a modern gui while debugging. Eclipse made it easy to configure the build with the cross compiler toolchain and it has a pretty good debugging interface. Some of the benefits of using an IDE are having multiple windows open to view registers and view several source files at once, searching and easily traversing the call stack. I'm not normally a fan of gui apps but sometimes it does help to have several sets of information visible at once during debugging.
Get the right version of Eclipse
 I spent several hours trying to get openocd gdb to work with Eclipse Indigo(?) v3.8.1, the version in Ubuntu/Kubuntu 13.04. I even tried with the Zylin plugin. Nothing seemed to work until I spotted some page that mentioned Eclipse Juno and I guessed that something in the Ubuntu 13.04 version of Eclipse might be causing the problems.
Installing the latest Eclipse release, Juno (4.2?) resolved all of the odd behavior such as Eclipse showing the 'run' and 'terminate' buttons but when clicking on 'run' only the terminate button was active, leaving no way to suspend/break into the current execution of the program. In addition even this behavior was broken, sometimes I had to hit 'run' twice for the target to actually start and 'terminate' wasn't consistently terminating the program.
Install the GDB Hardware Debugging plugin
Configure a Debug target
- Run->Debug configurations
- Create a new 'GDB Hardware Debugging' entry
- Select your application by browsing to it (I'd like to use an eclipse variable to fill this in depending on the active configuration but I'm not sure how to yet.)
- Select the 'Debug' panel
- Set the appropriate instance of 'GDB' in the 'GDB Command' to point at your cross compiler
- Disable 'Use remote target'. I chose this route because I wanted to be able to start openocd in the directory of my choice that contained the correct openocd.cfg file. This also makes it easy to add options such as verbose output.
- Select the 'Startup' panel
- You'll need to put the same kinds commands into the 'Initialization commands' as you would run from a gdbinit/.gdbinit or manually in order to get gdb to connect to the openocd gdb server. For my specific case these are:
- set arm abi AAPCS
- target remote localhost:3333
- monitor reset halt
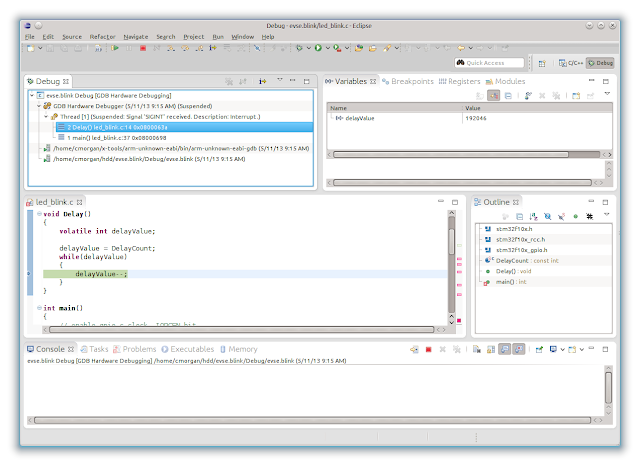
GDB+Eclipse in action


Comments
Post a Comment